
28 Aug 2025, By Dr. Shaojuan Xu | Academic Researcher
Growing up in a Chinese village and having been living in Europe for 15 years, I have observed the summer transition from pleasant sunny days to unbearably burning hot days in my home town over the last decade. So when I heard the people in the Cyprus Environment Symposium say “it was not that hot in the old days”, I was surprised that people 7000 kilometres from my hometown share the same experience; meanwhile, I’m also worried about climate change’s speed and impact scale.
As an urban researcher, I chose climate adaptation as my research direction, not because it is a fancy topic. Seeing my grandparents' generation carefully consume natural resources and use community power to prevent climate hazards, I know that there is a way that humans can live in harmony with the environment. The question is how to realise it in the modern world. When I started on the topic, the first challenge I encountered was that the awareness and acceptance of global warming are not uniformly distributed across different populations and places. Heat waves or other extreme climate hazards seem to happen randomly, not convincing all people to link them to climate change. One of the reasons for me to use a data-driven approach for my research is that data provides evidence and increases transparency and precision. With Earth Observation, we can prove that even though not every summer gets hotter than before, the frequency and the intensity of heat waves have increased over the last years.
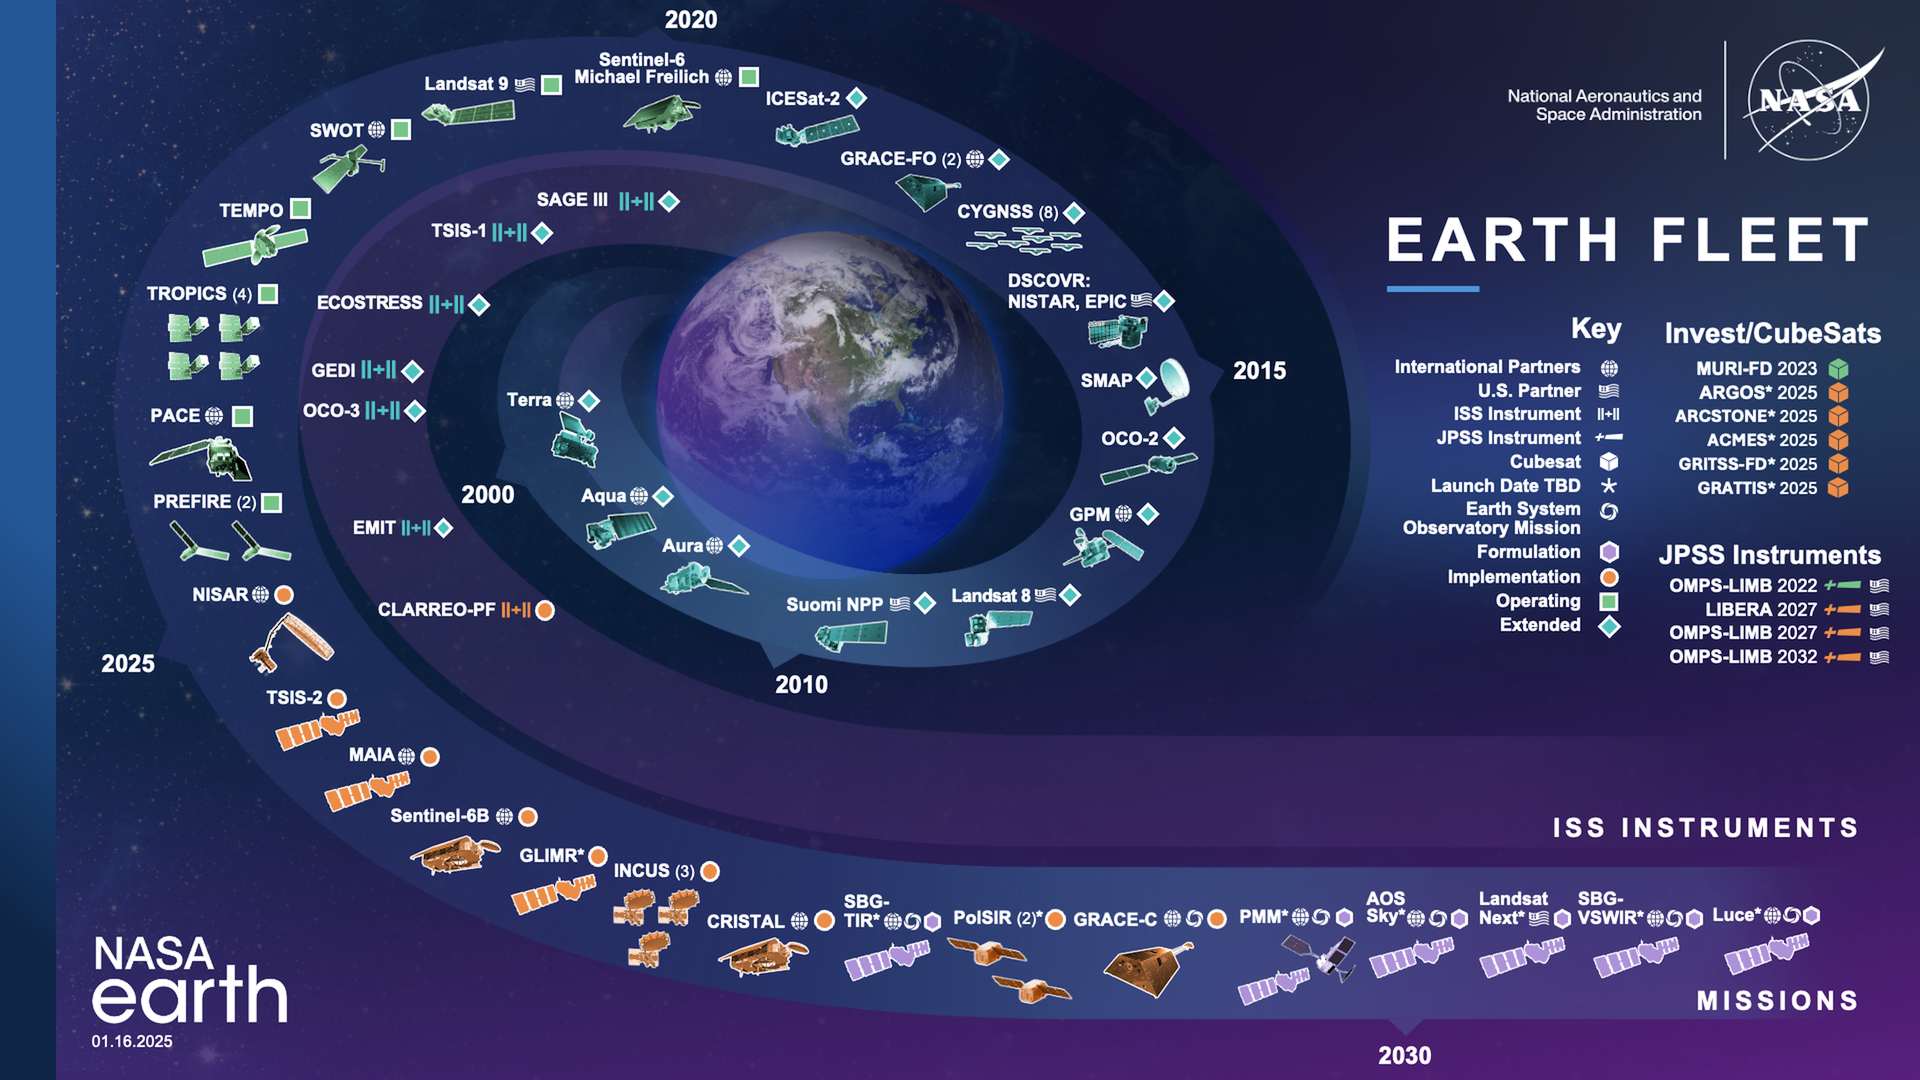
Since the 1990s, NASA has developed a large number of Earth-observing missions, which provide researchers with open-source data to address key issues about global climate change. Figure 2 shows an example of using these Earth observation data to retrieve the land surface temperature data of Nicosia over the last 23 years. Each point on the figure is a temperature measurement. We can see more and more high-temperature points have stacked in recent summers, meaning hotter and longer summers. Therefore, climate change is real. We need to change our mindset, meaning accepting that global warming is a fact and that we each have a role to play. Also, the urgency of action on climate change is critical because the longer we wait, the more complicated and expensive it becomes to avoid the worst impacts.

Once awareness has been raised, the next step is to take action, including diagnosing climate hazards at the local and regional levels, developing climate mitigation strategies, and integrating them into local urban planning and development policies. This is followed by the effective and collaborative implementation of climate actions. For all these components, a data-driven approach can leverage quantitative and qualitative information to inform, plan, implement, and monitor strategies that reduce climate vulnerability and enhance resilience.
More precisely, at the diagnosis phase, data and modelling have been widely used to assess climate hazards such as soil erosion, heatwaves, drought, and flooding; and analyse future risks, such as sea level rise and disease outbreaks. At the planning stage, we can integrate environment and socio-economic data to develop adaptation policies and urban planning, which align with local development needs, and select the most effective, feasible and equitable measures. For the implementation phase, data can enhance effective communication between stakeholders and informed decision-making. Overall, climate adaptation is a complex system, and data plays a crucial role in informing risk assessments, identifying vulnerable areas, prioritising interventions, and evaluating the effectiveness of adaptation strategies.
Typically, Earth Observation data is used to find temperature hot spots, map green infrastructure and identify areas most needing heat mitigation. Figure 3 illustrates the spatial pattern of land surface temperature in Cyprus, while Figure 4 presents the vegetation index mapping of Cyprus. By comparing these two maps, we can see that these hot spots have low vegetation index values, while cold spots have high vegetation or blue infrastructure. These maps enable us to prioritise green and blue infrastructure zones that deliver the most ignificant climate adaptation benefits.
Besides Earth Observation, other technologies such as photogrammetry and Geoinformatics also help us collect data. Digital twin, a dynamic, data-driven virtual model of an urban environment, has been widely used in climate adaptation planning. It enables real-time analysis, scenario testing and collaborative decision making. In the CATCH4D project, we used digital twin techniques to create an interactive 3D shade mapping tool (https://catch4d.de/en/the-3d-shadow-map/) for heat mitigation planning in Dortmund, Germany. The goal is to use shaded places and cooling spaces for heat-vulnerable groups, such as children, the disabled and older adults. Users can choose any location and time window, and find out how many hours this place is under the shade from trees or buildings. The locations of schools, hospitals, senior care centres, etc., are also highlighted in the map so urban planners can prioritise mitigation actions if they lack shading. One highlight of this tool is the tree planting tool, which allows users to simulate a tree-planting scenario. As figure 6-7 shows, after planting three trees, the total shade hours on the street have been changed from about 2 hours to 6 hours. Currently, this tool has been used by the city for their Green Connect project (https://catch4d.de/en/new-trees-for-westerfilde-and-bodelschwingh-catch4d-supports-gruen-verbindet-in-westerfilde-and-bodelschwingh/), which plans to plant 100 trees in a specific neighbourhood. This is a typical use case of data and digital products for climate adaptation planning.
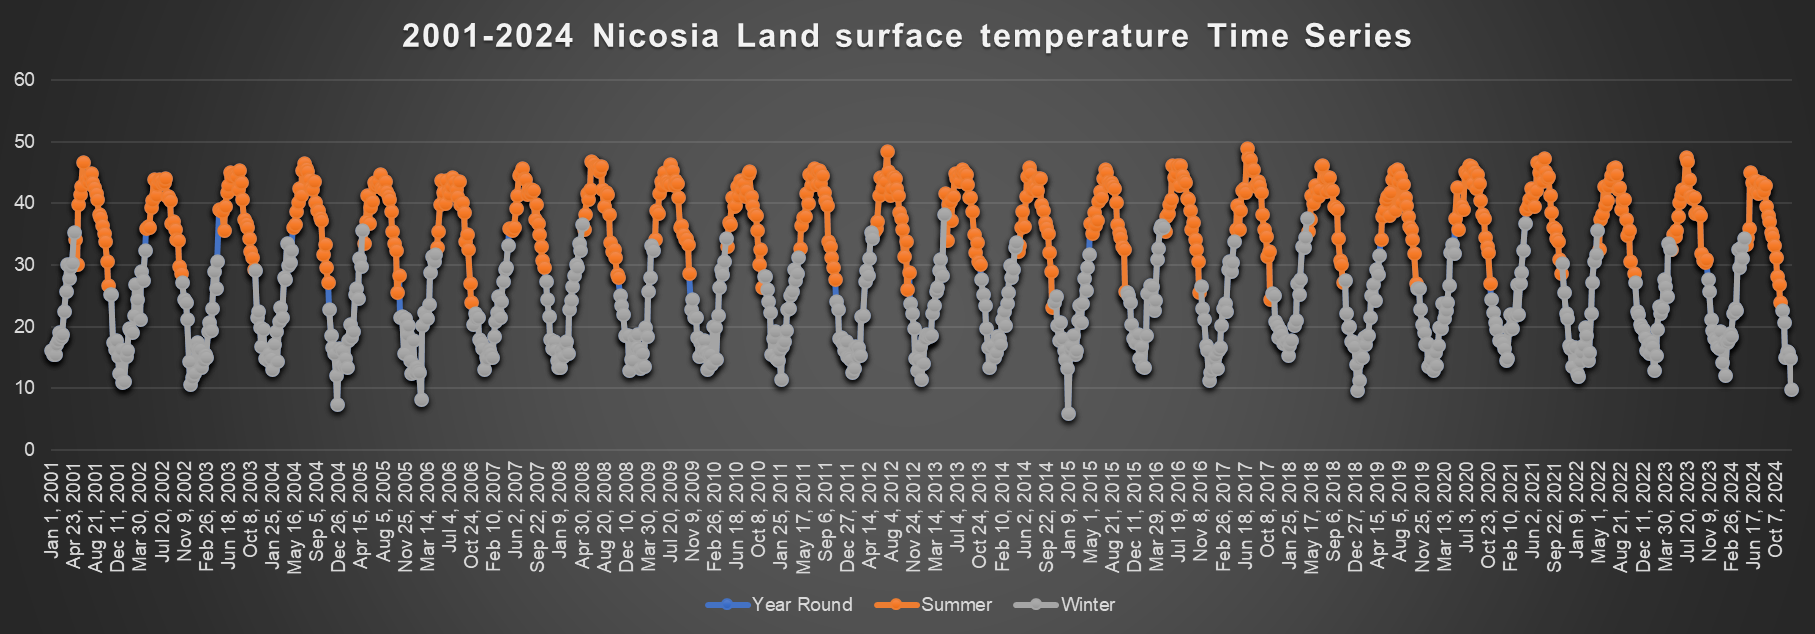
Figure 2 Land surface temperature of Nicosia retrieved from satellite observations.
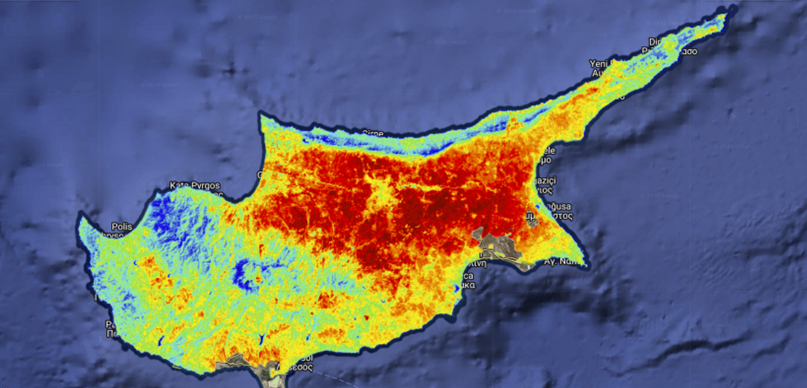
Figure 3 Land surface temperature of Cyprus mapped from Landsat satellites.
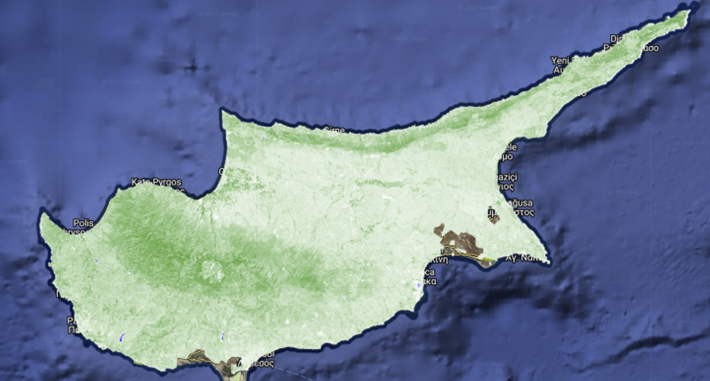
Figure 4 Normalised vegetation index mapping of Cyprus
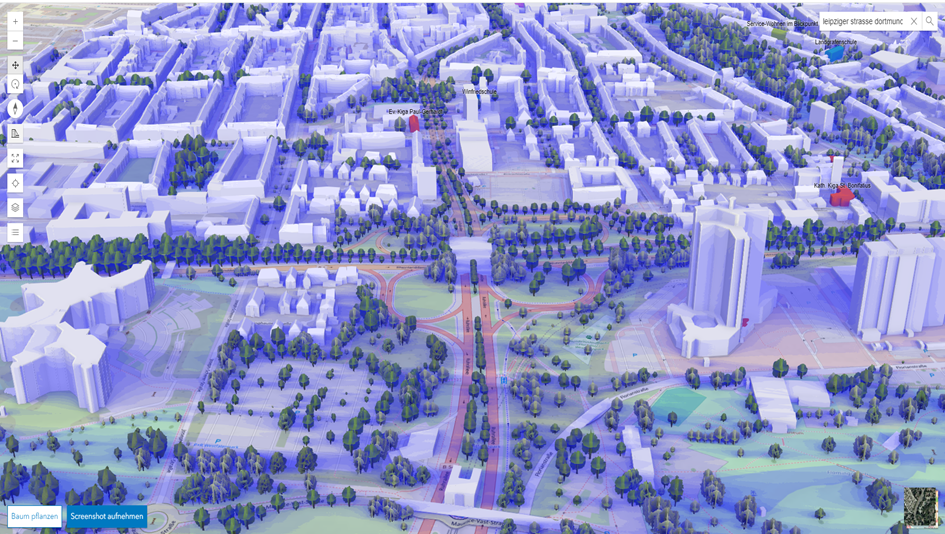
Figure 5 3D shade mapping tool from CATCH4D project
Data is a powerful tool, and along with technology development, new data will make humans smarter and smarter. However, data and technology shouldn’t make us arrogant and ignore the local and community knowledge. Data, particularly digital twin, should be used as a platform to encourage community involvement, assist effective communication between stakeholders, and promote citizens’ proactive contribution to infrastructure planning for climate resilience. Take the Green Connect project as an example, we presented our 3D shade mapping tool to the local community to identify the best locations for tree planting. One of the concerns we received was whether the new tree would cast shade on the top of their roof and make their solar panel defective. Through our 3D model, we clearly show that at a specific location, within a certain distance, the shade from the trees will not produce any shade on the building at any time. Also, our tree planting simulation tool provides great interactivity, scene simulation and visualisation, enabling the local community to select their preferred locations and types of tree to grow in their neighbourhood. Among the 100 trees, 50 are to be planted on public land and 50 others are to be given away to property owners. The participatory design procedure creates valuable memories within the community and also enhances the sense of belonging in the neighbourhood. During the stakeholder engagement activities, we also conducted surveys to collect the public’s opinions. One of the feedback we received was that the local community wish to receive more support from the Health Department of the city for heat mitigation. We delivered messages to the local government and received great appreciation.
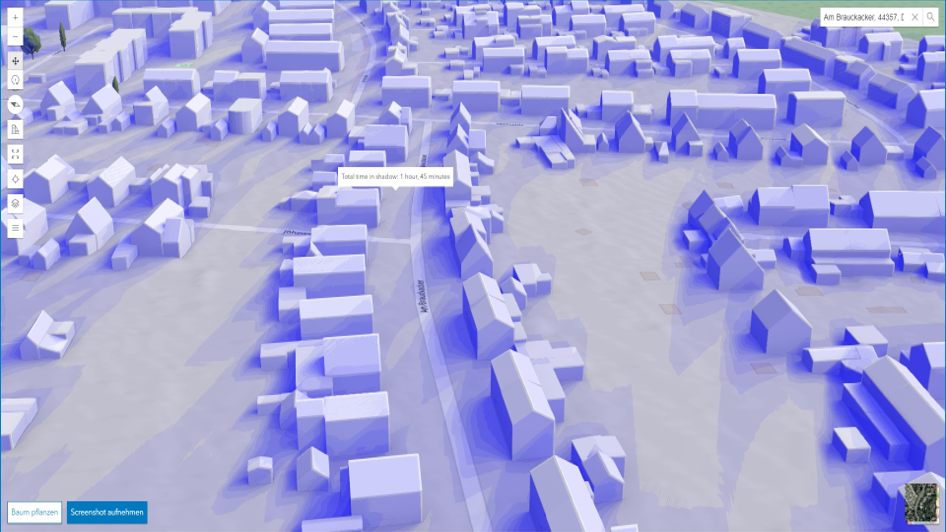
Figure 6 Before tree planting, the place is 1 hour and 45 mins in the shade
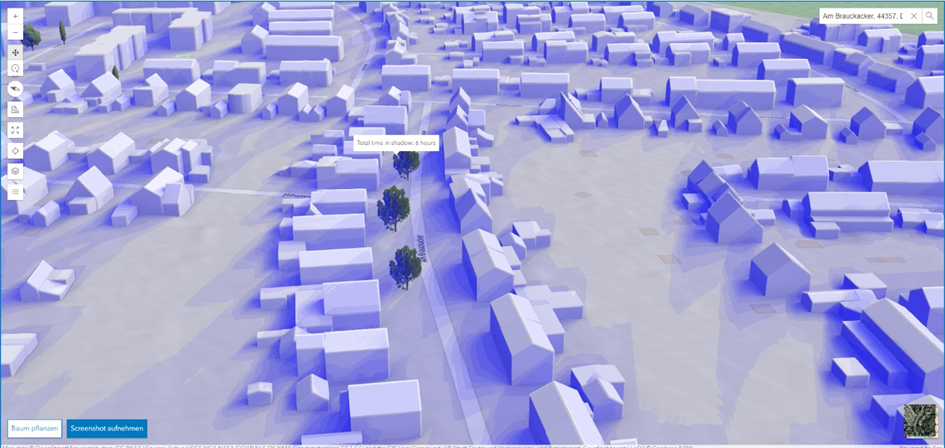
Figure 7 After tree planting, the place is 6 hours in the shade
In summary, data has played a crucial role in climate adaptation by enabling evidence-based decision-making, effective planning, and the integration of community perspectives. Digital twins will allow us a participatory and collaborative processing to help us understand public preferences and willingness to pay for green and blue infrastructure options, ensuring that adaptation measures align with community values and needs. In this article, urban heat and mitigation were taken as a case study of climate adaptation action. Certainly, a data-driven approach can be used to address other climate hazards and mitigation strategies. The EU has been calling for innovative research on digital twin-supported urban planning for climate-neutral and climate adaptation. Here, I see a great opportunity for EU cities to share knowledge, pool resources, pilot new solutions, and advocate for common goals at the EU level.
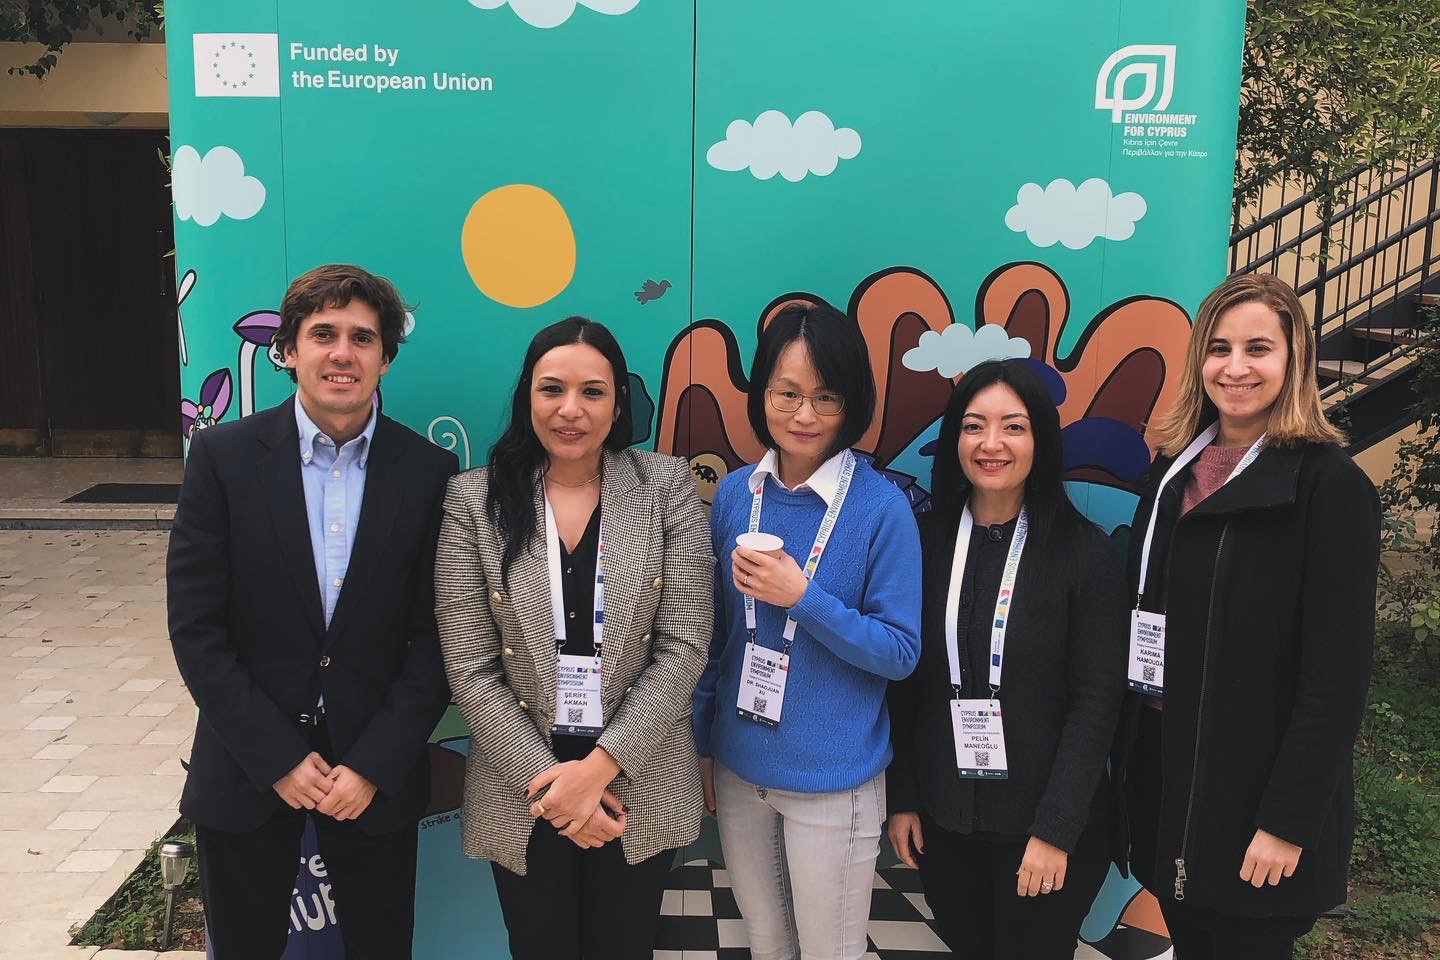
During my visit to the island in December 2024 to deliver the keynote speech at the Cyprus Environment Symposium, I was deeply touched by the friendliness of the local people and their passion for environmental protection. I’m also impressed and inspired by local researchers’ creative ideas and their deep involvement in local communities. From a research perspective, I also found the potential synergies between my research and local experts. For example, Professor Marina Neophytou’s work on urban thermal modelling and building energy efficiency. In the CATCH4D project, we also created a 3D thermal model for detecting building energy efficiency (https://catch4d.de/en/3d-heatmap/). There are still many shared topics to explore and much valuable research to discuss together. I look forward to future opportunities for collaboration and upcoming visits that will deepen our collective efforts.
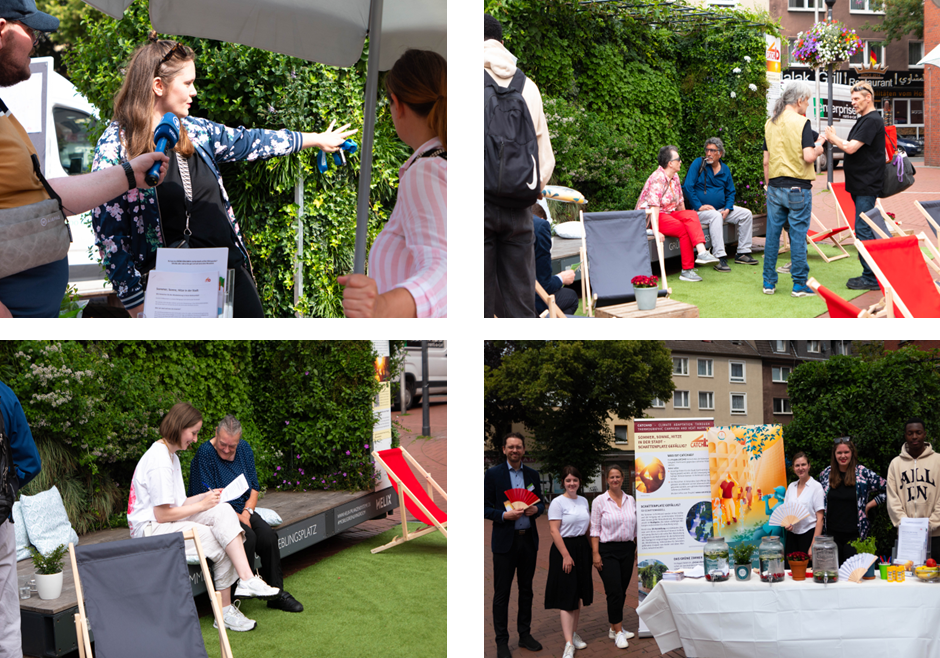
Figure 8 Stakeholder engagement at a local neighbourhood of Dortmund
Dr. Shaojuan Xu
Discover MoreThe content of this blog is the sole responsibility of the author and do not necessarily reflect the views of the European Union.